
Operations & diagnostics
Read, filter and inspect logs
On this page
Logs show whether WordPress generated an email, which type was detected, who received it and whether the provider accepted it. They are your most important diagnostic tool.
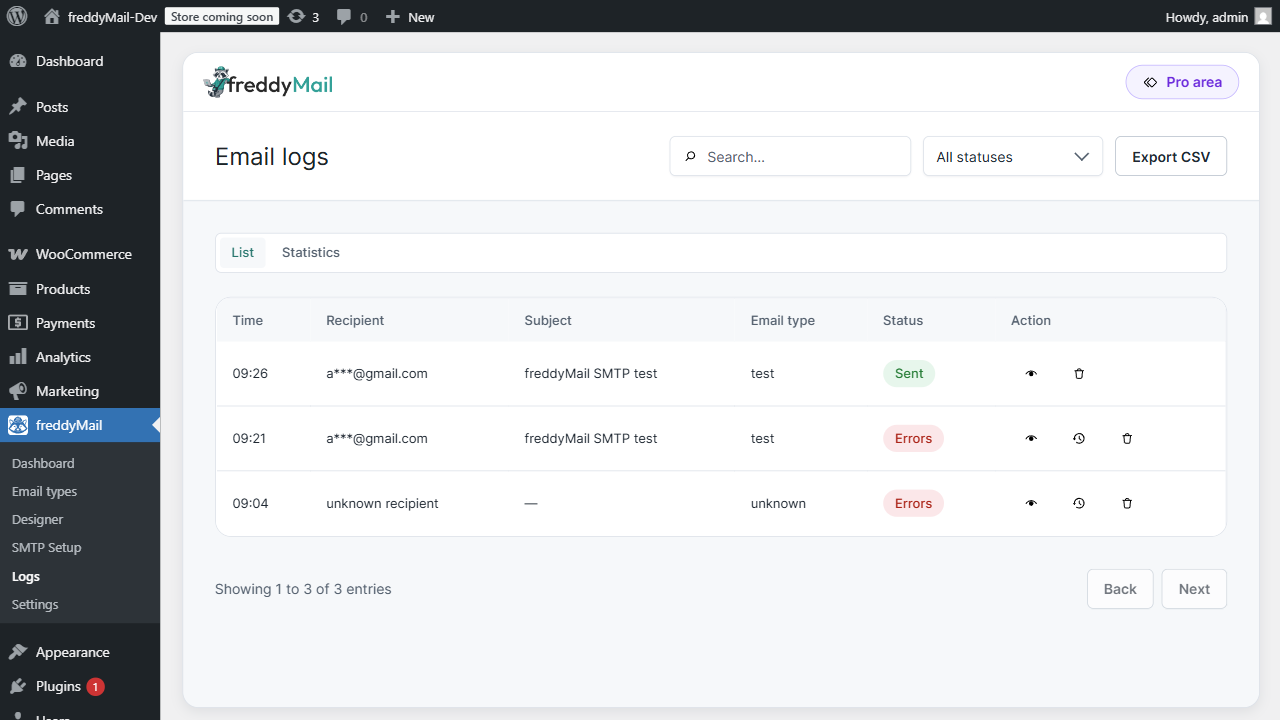
Understand the status values
- Success — the provider accepted the message. Inbox placement is not guaranteed.
- Error — credentials, DNS, rate limit, sandbox or sender may be affected. The provider response sits in the detail view.
- Queued — the mail is waiting (e.g. due to WP-Cron delay).
- Skipped — FreddyMail intentionally did not send (e.g. staging mode active).
Use filters effectively
- Set Status to
Errorsto see all problems of the last few days. - Use the search field to look up a recipient or subject when a customer reports they got nothing.
- Open the detail drawer on a hit to see the exact timestamp and email type for that entry.
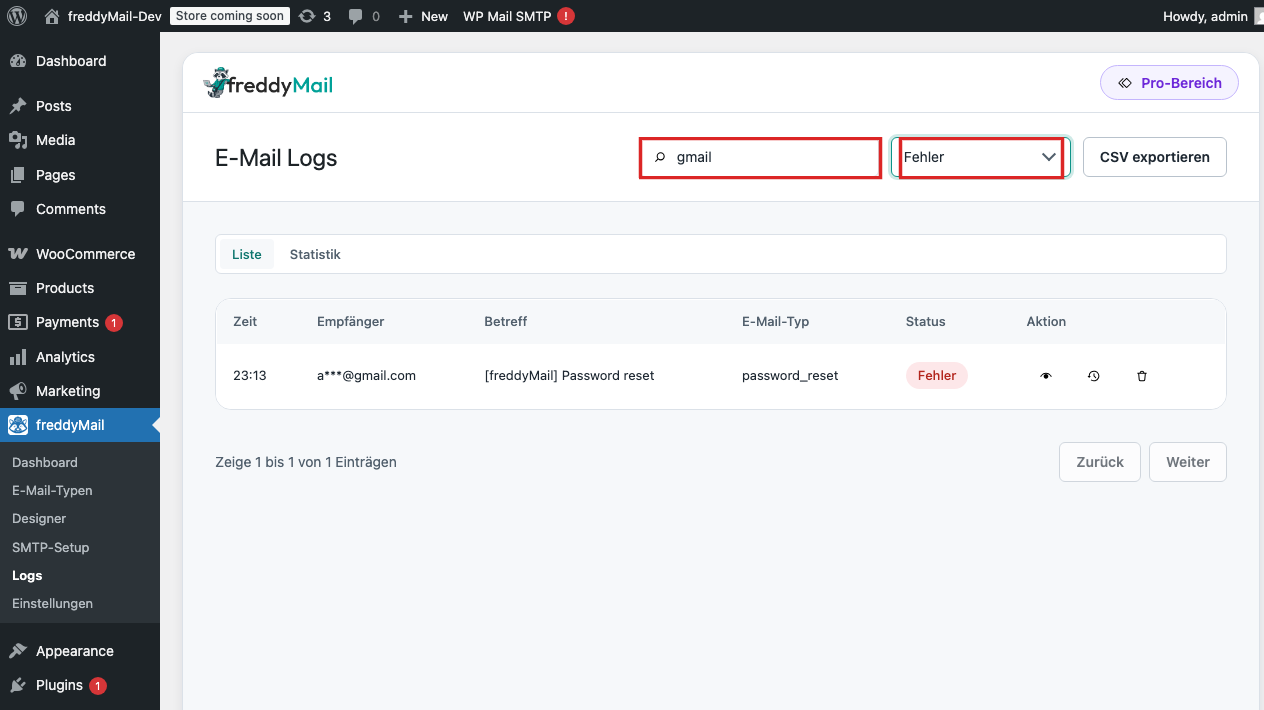 Annotated
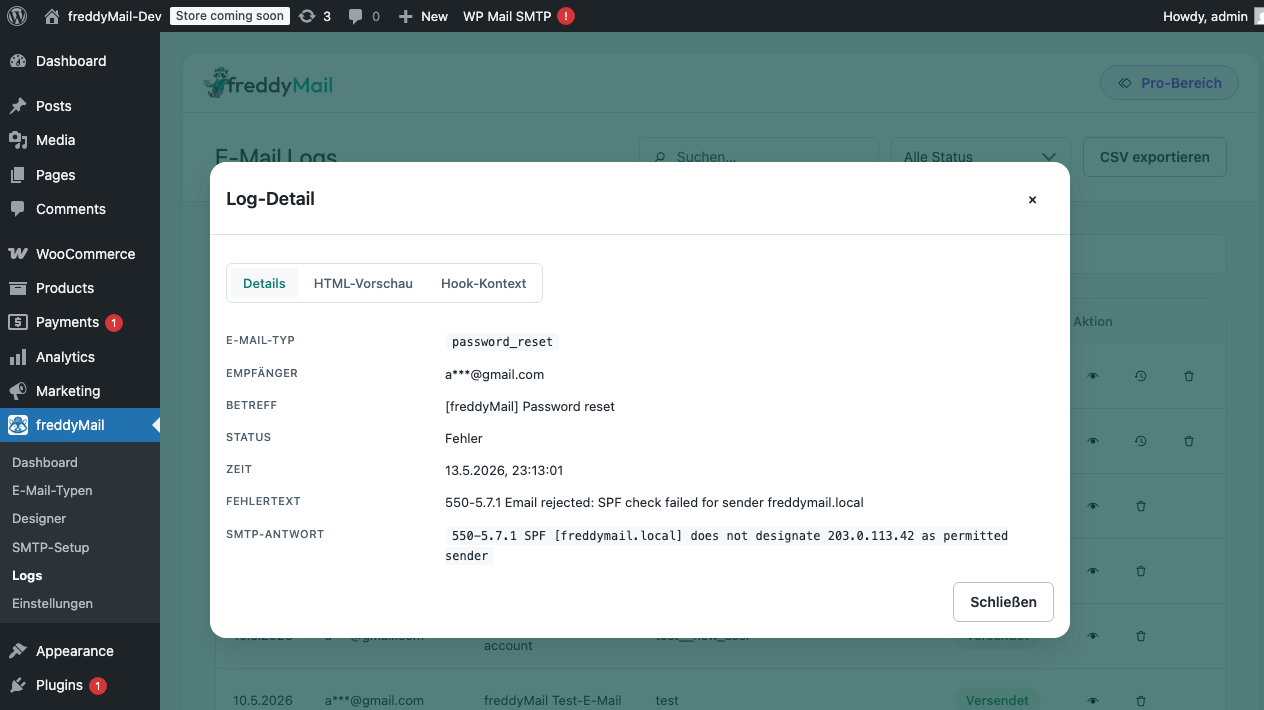
 Open the detail drawer
Click any log entry to open the detail drawer. Inside you find:
- Original headers and body of the sent mail.
- Provider response (e.g. SMTP code
250 OKor550-5.7.1 SPF fail). - Provider message ID for correlation with the provider backend.
- Round-trip time and — if available — webhook data for later status changes (bounce, open).
Delete logs deliberately
- Before deleting, check whether the entry is still needed for support or audit.
- Click the trash icon in the row — a confirmation modal appears.
- Confirm the modal; the entry is removed permanently.
- For regular cleanup, shorten the retention window under Settings > Diagnostics.
- After deletion, send a test mail so a fresh log entry exists.
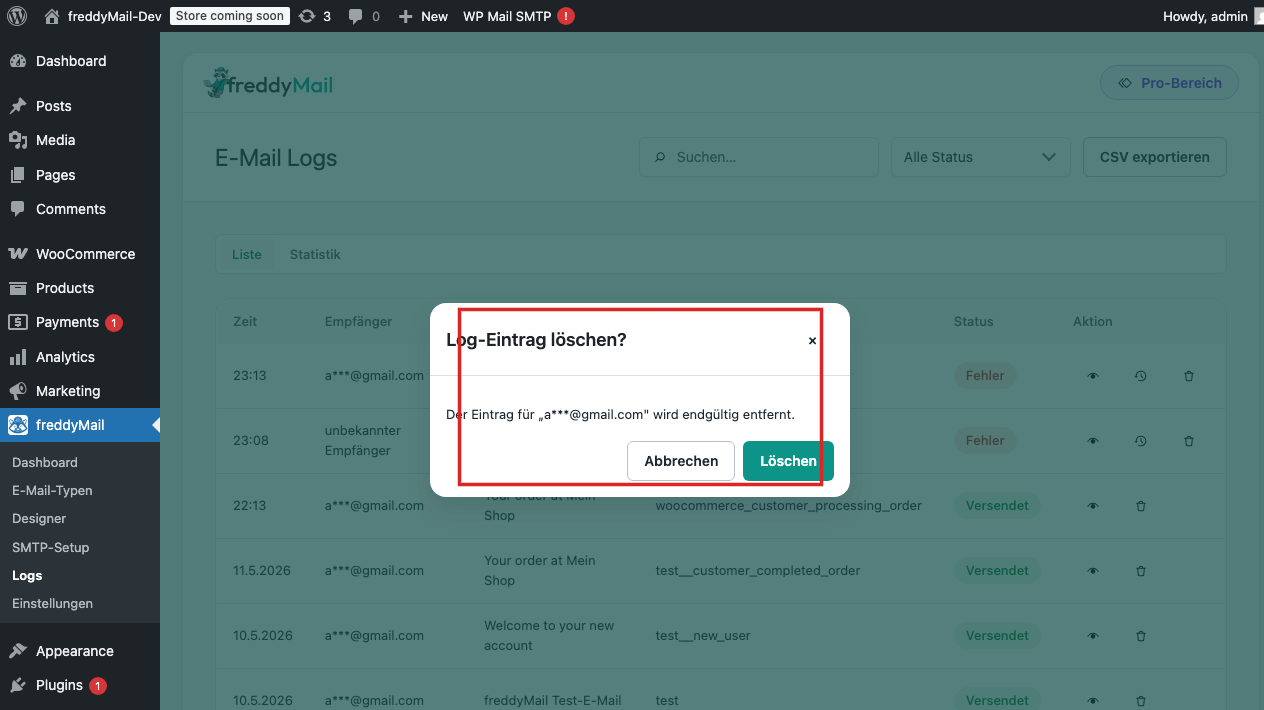 Annotated